How I debug programs in Vim
Published 2022-01-25 on Yaroslav's weblog
This text is also available in other languages: Русский
I like to use separate tools for different tasks, and also like it when those tools integrate with the other tools I use. Unfortunately I haven't seen much information online for possible workflows on debugging programs with Vim. There is information but it is all spread out. So I decided to write about the workflow that I've built over the years for writing and debugging programs with Vim.
Many, or most, IDEs already come with some sort of debugging facility. But those IDEs are not vim, and more often than not, they also come with a lot of other features that frankly are not very useful. And no, vimifcation plugins don't count, most of them don't cover even half the functionality that vim offers.
I love using vim (technically neovim, eh, same diff), I really think that it is the best text editor out there. Hell, I even, unironically, think it might the program with best UI/UX. Sure it is not intuitive at all (insert obligatory exit vim meme), but once you learn the ropes of it, and it doesn't take as long as they meme it to be, it's just bliss. In shot, vim is a lifestyle, not a program.
The problem is that learning to be a power user of vim can take time. And to be able to efficiently develop programs typing them is not enough. You also need to navigate around code bases, quickly fix the most basic of errors (such as typos), reduce repetitive tasks (e.g. autocomplete), and of course, debug and profile.
Fortunately both vim and neovim, for at least some 3–4 years now, offer facilities to integrate software development and debugging tools with ease. Since I use neovim, some things that I talk about here might differ a little bit.
Development tools
It used to be that each editor/IDE needed to have plugins developed for, or even baked into, them individually. This meant that efforts had to split for every and each language and editor combination, which meant that not every editor had support even every popular language.
Fortunately, Microsoft did a very un-Microsoft thing, and instead of baking in another completely new implementation of IDE-like development tools for each language to their VSCode editor, they developed what now is called the Language Server Protocol1, and with the help of Red Hat et al they open sourced it and standardized it.
In short, the Language Server Protocol (LSP) is just a JSON RPC protocol for communications between a server that provides the functions, such as autocompletion, linting, go-to-definition, etc. and the client which would be the IDE or editor, which basically displays the results. And one of the editors that supports LSP is vim. In fact, at least in neovim, the support is built in.
LSP
In order to use LSP in neovim, you need to enable the plugin and configure the LSP server(s) for your language(s). The good thing is that configuring it is pretty simple and straightforward, especially since there is a plugin that already comes with default configurations for a lot of popular languages LSPs.
I use vim-plug to manage my plugins, so first I added the official lspconfig plugin:
"...
	Plug 'neovim/nvim-lspconfig'
"...
And then proceeded to configure it for my needs by adding the configurations for the LSP servers for C, Go, Rust, Python and Javascript, the languages that I use the most often:
" LSP
	set omnifunc=v:lua.vim.lsp.omnifunc
	lua require('lspconfig').clangd.setup{filetypes = { "c", "cpp", "objc", "objcpp", "ch" }}
	lua require('lspconfig').gopls.setup{}
	lua require('lspconfig').pylsp.setup{}
	lua require('lspconfig').rls.setup{}
	lua require('lspconfig').tsserver.setup{}

" LSP keybinds
	nmap <silent> gd <cmd>lua vim.lsp.buf.definition()<CR>
	nmap <silent> gD <cmd>lua vim.lsp.buf.declaration()<CR>
	nmap <silent> gK <cmd>lua vim.lsp.buf.hover()<CR>
	nmap <silent> <leader>n <cmd>lua vim.lsp.buf.rename()<CR>
	nmap <silent> <leader>b <cmd>lua vim.lsp.buf.formatting()<CR>

" neovim overrides my omnifunc with whatever ccomplete is, so I use this
	autocmd FileType c,ch,header,cpp setlocal omnifunc=v:lua.vim.lsp.omnifunc
Of course, in order to use the functionality, you also need to have the LSP servers installed in your system. In the case of Go, it comes with the standard toolchain, same as with Rust. For C, you will need clang, as far as I know GCC doesn't provide an LSP implementation.
The keybindings in my config make it so that I can go to definition with gd,
go to declaration with gD, get a popup with information implementations and
comment documentation with gK, rename variables with <leader>n (leader is
space in my config) and process the file through a formatting tool (e.g. gofmt)
with <leader>b.
Other plugins
Now, LSP provides most of the functions you would expect from an IDE, but there are still some other plugins that I use for better quality of life. Namely:
"...
	Plug 'ervandew/supertab'
	Plug 'majutsushi/tagbar'
	Plug 'tpope/vim-commentary'
"...
The first one, supertab, makes using autocompletion much more comfy. By default the omnifunc autocomplete is bound to <C-x><C-o> which is not very comfortable to enter. Usually, in shells and other editors, you use Tab to autocomplete, which is a pretty sane way to do it. But sometimes you actually need to insert tabs manually. That's where this plugin comes in, since it intelligently chooses whether to insert a tab, or autocomplete on pressing the Tab key.
The next is tagbar. This plugin allows you to open up a sidebar of sorts that lists the global variables, data/struct/type definitions, and functions in the current source file. It requires a ctags implementation to work.
Finally is vim-commentary, which provides an easy way to comment out multiple lines easily. Not AS useful as the other ones, but still handy nonetheless.
Debugging
Sooner or later when writing programs and testing them you come across some kind of programming error that causes it to misbehave. You can try to find the problem manually by looking at the code and scratching your head, but a much better way is to fire up a debugger and go step-by-step over the program execution in search of your bug.
For some time, at least for C and other languages that are supported by it, I would just open gdb in a different terminal window and keep my source file open in vim in another. But a couple of additions were made to both vim and neovim which made it much pleasurable to debug programs.
The first is terminal which, just as its name implies, is a terminal emulator
inside vim. Basically it allows you to open a terminal inside a vim buffer. For
me personally this feature by itself is not of great use, since I use a tiling
WM which already makes it much more comfortable for me to move around terminals.
However, it gives way to a plugin that is much more useful, and which depends on
this functionality.
Introducing Termdebug. This is a plugin which is built into both Vim (version
= 8.1) and Neovim. What it basically does is it opens two split windows, one with gdb and the second one with the output of your program. You can then input gdb commands directly into the gdb console, or through some vim-provided shortcuts.
In order to start using Termdebug, you need to first load the plugin:
:packadd termdebug
And then load it providing the name of the binary that is going to be executed by gdb:
:Termdebug <path to binary>
You will be greeted with two new split buffers, one with the program output and the other with a gdb console. They are both terminal buffers. The way you use those terminal buffers in vim is, you enter insert mode to type into the terminal, and exit insert mode with <C-\><C-n>. Why not escape? Because some terminal programs make use of escape, for example, vi mode in bash or zsh. Or maybe even another vim instance inside vim, why not ¯\(ツ)/¯.
After having opened Termdebug, you can run the program the classic way from gdb.
Or from within vim with :Run <args>. Other useful shortcuts are :Break to
set a breakpoint at the current line of code, :Clear to delete a breakpoint at
the current line if there's any, :Continue to resume program execution, etc.
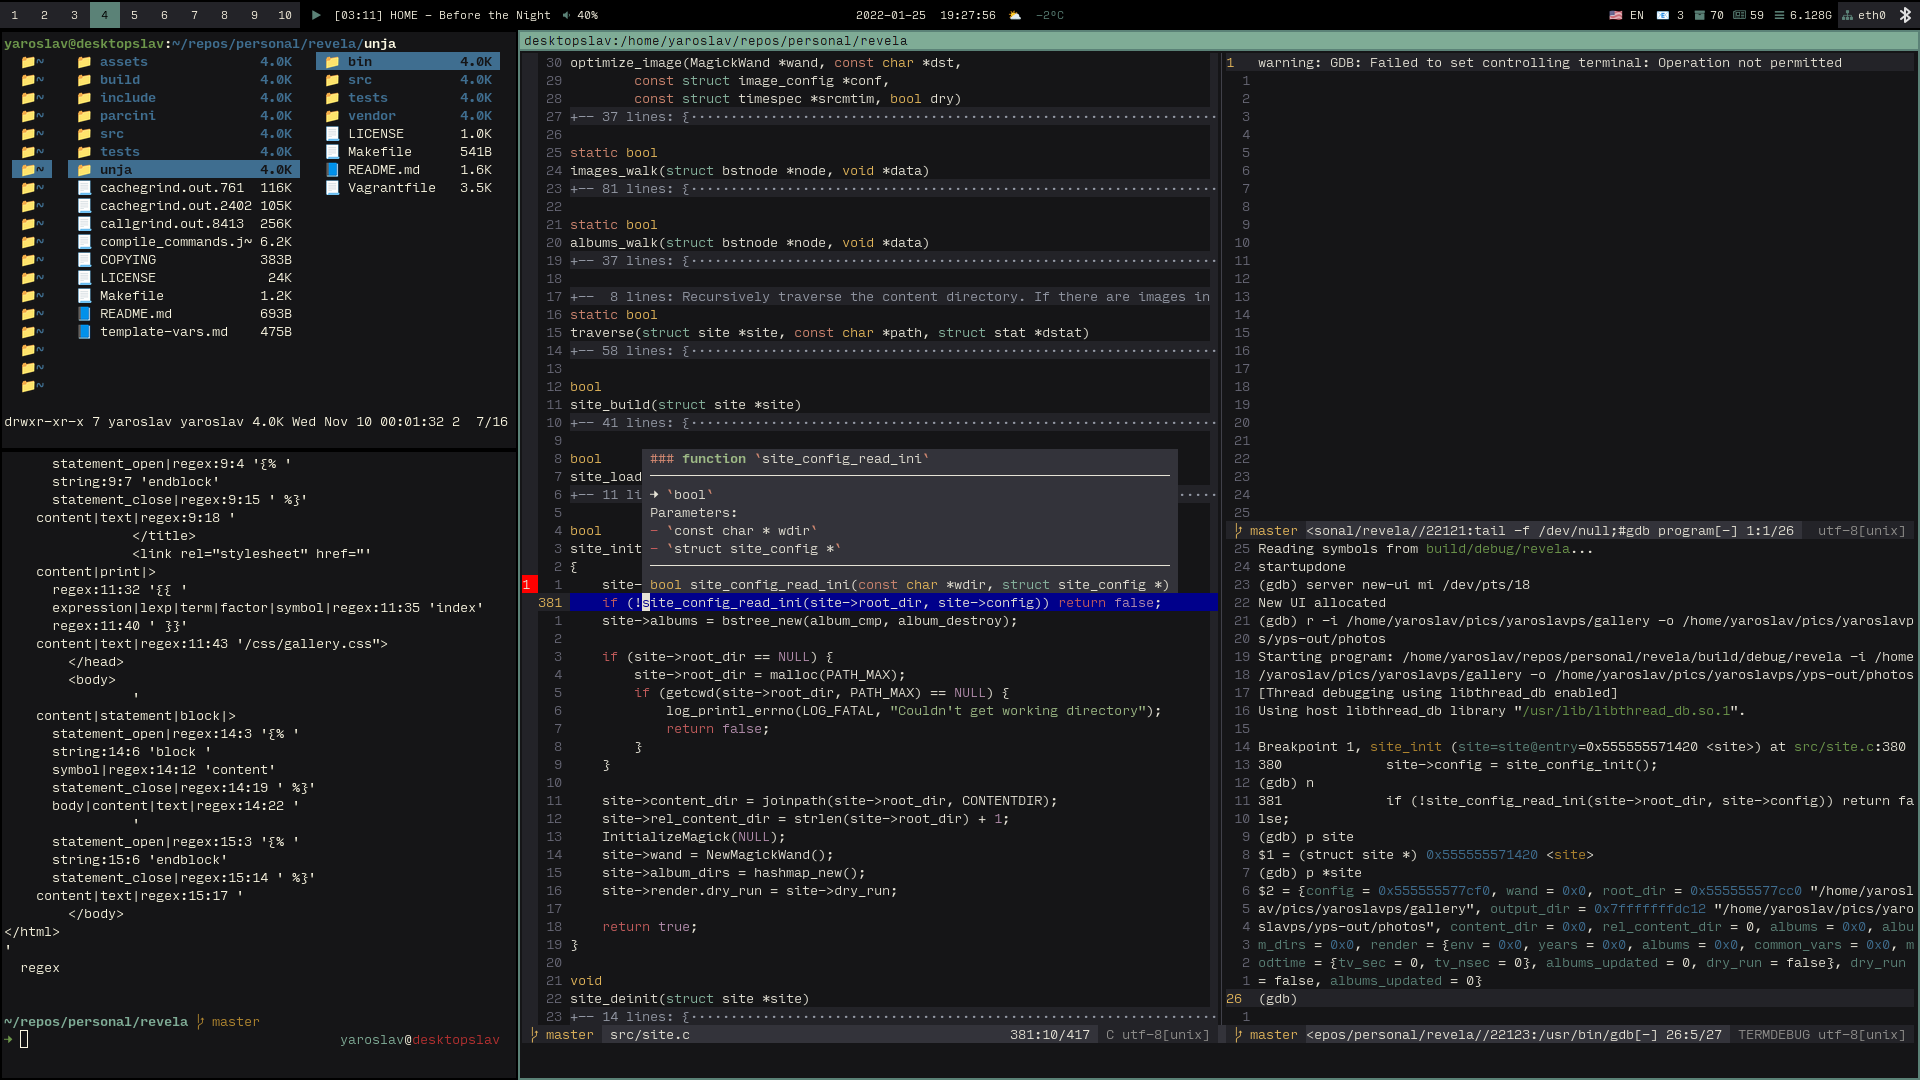
An example debugging session.
What makes this really wonderful is the fact that you see the process of debugging straight in your source file. You don't have to constantly list the code inside gdb, and you can just navigate around files to set or clear breakpoints.
Of course, since you're just debugging programs with gdb the usual rules of
debugging with gdb apply. For example, you need to compile your program with
debugging symbols, i.e. with the -g flag.
Afterword
These are just of the plugins and configurations that use in vim to help me write and debug software. This is, of course not meant as an in-depth tutorial or guide on how to configure vim or how to properly debug programs. This is just a mere guide on how one can use vim in conjunction with other tools to develop and debug programs. There's a lot of information on the internet on how to configure vim or how to debug programs with gdb, and using other tools such as valgrind and ASan.
If you want to know more about lsp in neovim, you can read the help page inside
neovim by entering :help lsp. The same goes with Termdebugger: :help Termdebugger.
If you are interested, you can check my full neovim config here: https://git.yaroslavps.com/configs/vimrice/

If you have never used Vim before, and this article caused you to open it in a whim and now you can't exit it, this picture might be helpful.
Not completely Unix-y, but somewhat adherent to the Unix philosophy in the sense that one program should do one thing and do it right. A shock coming from Microsoft, I know. You can learn more about it here: https://microsoft.github.io/language-server-protocol/
https://www.yaroslavps.com/weblog/debugging-in-vim/
© 2018—2026 Yaroslav de la Peña Smirnov.